The table that shows each value of one or many single or multi-component amounts is the Truth Table. It is the solution for students to do a logical propositional calculation or with Boolean Algebra. Although, there is another method that is equivalent to truth tables, but simplifies the task, called karnaugh maps.
What are Karnaugh Maps?
It is a schema that is often used to reduce and dwarf an application and term of operations of Boolean calculations, making a schema of the model resulting in performing the large operations in a single Boolean expression.
It is very similar to the Truth Table, it calculates the amounts that can be shown in the different variables that have input and giving a result in the output. Also called "map-k”, and is defined as the series of boxes in which each of them is given a binary number, with respect to the amounts found in the entry.
The number of boxes or cells found in the Karnaugh Maps is similar to the total of the composition of the amounts that are in the input, just as it works in the Truth Table, the set of columns is used, for example, in a map that has three values, then when the two are raise to three the result is eight (23=8).
In Karnaugh Maps The amounts must be placed in such a way that the columns and horizontal boxes remain the difference of one amount, in this way it is minimized to an easy way of six values.
The Characteristics of Karnaugh Maps
It is a methodology that has a wide variety of prototypes that give a range of content and purposes:
- One of the methodologies frequently used to reduce Boolean algebraic calculations.
- The name assigned to it is "Karnaugh table" or the "Veitch diagram".
- Also known in a simplified way in its name as "K-Map or KV-Map".
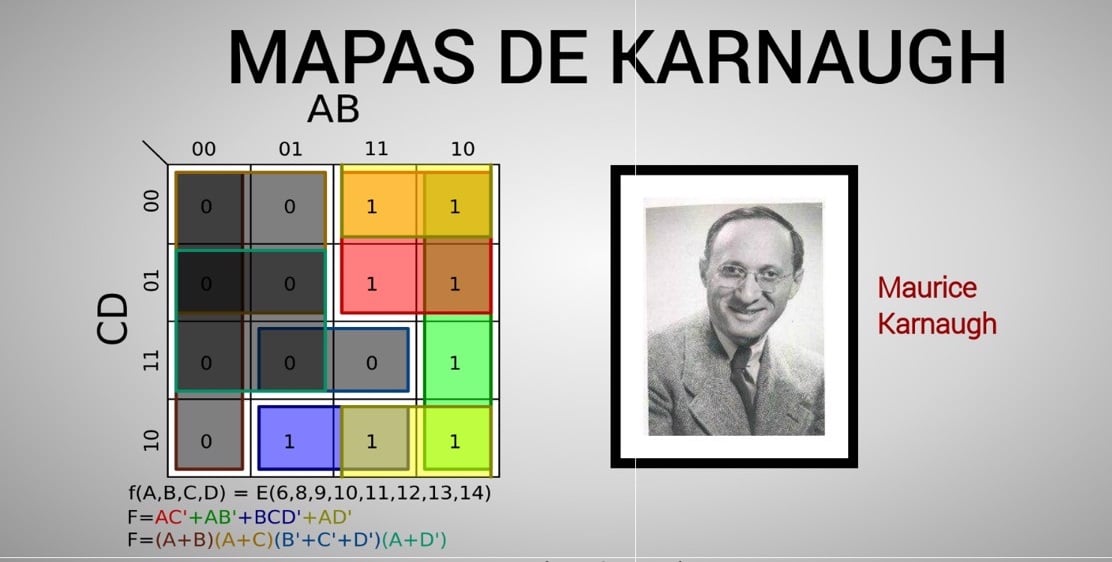
- The physicist Maurice Karnaugh and also a mathematician who belonged to Bell Laboratories, was the creator in the year 1950.
- It serves to simplify the result of the sums.
- It is the result of the sum or union of some results.
- It is the composition of a group of rectangles.
- It is based on automatic operations.
- Each of the boxes makes up a row of the truth table.
- In this table the quantities of the truth of a maxim arranged are placed.
- Depending on the values they have in the truth table, the amounts of their units can be placed.
- It is a table that shows the combination of the values of some functions of “N" values.
- It is composed of two raised to “N” rows (2N).
- In which two squares are joined and one value is cancelled, when four squares are joined two values are cancelled, in this way the process is followed.
- In each box a value is placed, which can only be “0" or "1".
- Depending on the amount that is assigned to each function of the column. It is used until reaching six values.
- It can be done for functions that have a minimum of two sum ranges of results.
- It is a choice that different values are found, even if they are similar.
- When in an operation the union of the values is made, in the same way the amounts that are integrated are eliminated.
- The boxes that are free are used in such a way that, in the middle of the boxes, regardless of the position, they have a logical approximation.
- In these "K" maps, there are some contiguous minterms, which are specified as a pair of them, which have difference in variables.
- Each one of the groupings determines an expression of the result, and the term that concludes must be “OR"(what is a sum) of all the values of the result.
- If the squares in the K-map are related, a value of minterms is joined, resulting in a power of the number “2".
- It is recommended for functions that have a maximum of six values.
- When the boxes are found a large number of “1” united, the termination remains with two values, when eight are joined “1” three values must be eliminated to arrive at a single-valued term.
- The functions are expressed in a canonical way.
- With this map you can build a digital circuit, which is perfect for functions from algebra to electronics.
- It has a wide variety of minterms unions
on the maps. - The map will depend on the number of values found at the beginning of the function.
How is the Way of Making the K-Map
In the matrix chart you can have different procedures that give an expected response, in what follows the methodology of this map will be shown.
The first step
- Three variables must be placed in a logical table, which are designated with the letters “ABC".
- Then using the logic, which will take care of doing the procedure to obtain a result "Y” that is needed.
- The result is respectively optimal. Offering a higher cost for its execution.
- With this type of Karnaugh tables, simplification is achieved and the way of placing the variables in the table is improved, locating the “1” of the function “Y” in the corresponding position.
The second step
- Here the lines of the arrays are given definition.
- As a sample, the flat line in which the variables are assigned “AB” is given, and in the column the value “C”.
- The values must be increased, here the null ones must be indicated with a line in the upper part of the variable or a quotation mark is also used.
The third step
- The values are placed on the map “ABC” respectively with the amount with the highest value of the expense “Y".
- Each of the values must be located, in their positions.
- "1” at position A´BC´; “1” for position ABC´ and “1” at point A´BC.
- These variables are called minterms.
The Fourth Step
- We proceed to execute the reduction through the k-map.
- The respective logical expressions are close, eliminating the extra values.
- In certain circumstances, the sum of the respective expressions called minterms of “Z” overrides the value of “A”, because it is presented additionally.
- Followed by the Boolean logic action.
- In a simple process, you have to define that a value should be nullified at the time of summation.
- To finish the sum of "Z+X” is the result of the simplified relation of the values in the table of values.
What is the Advantage of Karnaugh Maps?
In the year 1953, who developed the methodology or the way to reduce the operations was the engineer Maurice Karnaugh, by means of some charts or tables, offering alternatives, where an example is given in the following.
In Karnaugh tables it is allowed to select the way to transform a truth table of Boolean functions, in a simplified SOP way. Therefore, it is giving options of simple rules to carry out the reduction and emphasizing in giving a simplicity to carry out the method.
Giving the opportunity that the method is simple and does not take much time to do, showing that it has efficiency when compared to other logic methods
The Karnaugh Map Rules
The construction of this graph must be governed by the rules as explained, for this reason a list of the instructions that must be carried out for this purpose is shown.
The first thing that must be done is to verify that the only way to fulfill the groups of terms is by taking the value of “1".
These groups can only be made flat and linear. It should be noted that all groups must be made up of 2n values, trying that each group is made up of the variables (1,2,4, 8,…,2n) number of digits from one to one.
For the table or map to end up with a good reduction, the grouping has to be treated with more complexity.
You should always be aware and not leave aside the variable "1”. and allows the groupings of “1".

The groupings can be joined with the squares that are in the extremes of the map. The minimum number of groups that can be analyzed must also be analyzed, all under the rules mentioned above.
What are the Steps for Karnaugh Map Reduction?
To carry out the steps of this reduction in the K table, a methodology must be followed with different values at the beginning and the use of two to five amounts is recommended. That is why the following explains the entire route that must be done to make the correct decrease.
How to create Karnaugh Maps?
Keep in mind what is going to be indicated below:
- They must have a lot of mode 2 framesn, being “n” the value amount.
- A sample would be variable 2 of the table, it would result from four frames, in the case of 3 values the frame corresponds to eight and if it is a value of 4 then the frames will be sixteen.
- At the end you can see how the map would look with respect to the number of values at the beginning.
How does are the Values in the Input combined?
What is needed is that at the end of the map the phases are at 0 and 1 depending on the composition of the values that are located at the beginning.
In an example of a map that has 3 values.
- The values of A and B must be attached to the top of the upper point, being in the vertical lines.
- In these vertical lines of the map are the probable mixtures of these 2 values: 00, 01, 11 or 10.
- In the horizontal part, you must put the remaining values.
- The values of C, and the probable states on each line that they are 0 or 1.
- You must always be aware that the 0 and 1 of each value are ordered as they are in the maps reached.

- It is part of the norm that when a relation is made to another map, what must change is the amount of each variable.
Fill the Output Values
The Kamaugh maps after their creation are completed with the information, the variables of the end for each group of the variables of the beginning.
There are only two options, one is that the truth table is available and the other is that the logical definition of the electric map is available. Typically, the truth table is used.
Then it is passed to the logical content, counting on the data of the created table. In this table you must put a «0» in the box in which the composition of the final values is made, the variable «0» in this table and also the «1» in the box containing the composition of the values at the end «1» in that table.
If you have the logical combination, you have to be careful of the different compositions of the result values, these are made up of the output with a result in «1«.
How is the Grouping of 1 done?
These values must be joined evenly, four to four, eight to eight, and so on. When the groupings of the «1» on the map, you have to make different groupings of «1» of (2n), it is necessary that these groups get hold of all the «1» Where necessary, it should not be taken into account that these values already belong to other groups.
The important thing is that these groups must abide by the rules, they cannot join diagonally, only vertically and horizontally.
How to Get a New Reduced Relationship?
A value is obtained for each grouping of «1«, This is the result of the sum of this. The results must be added.
To get the value of the function, a group of «1«, at the same time it must be verified that the values change in amount.
If there is any change in value, whether from (0 to 1) or from (1 to 0), that value becomes null.
For what Reason Variables that Change are Deleted?
At the moment that a variable is found whose value is modified, in the groups of "1", it happens that this variable is multiplying several times, one on one side and the other on the other side. And what is needed is to diminish the function.
How Are Karnaugh Maps Located?
It lies in a two-dimensional conceptualization of the function to be reduced. When this is presented as a truth table, in this case the map of K will be displayed in a way similar to "2D".
Because the first table has "n” values and has 2n columns, the map of K is composed of cells equally of 2n. The elaboration of the K map encodes each one of the grids with a binary number, in this way each contiguous box is also assigned a single digit.
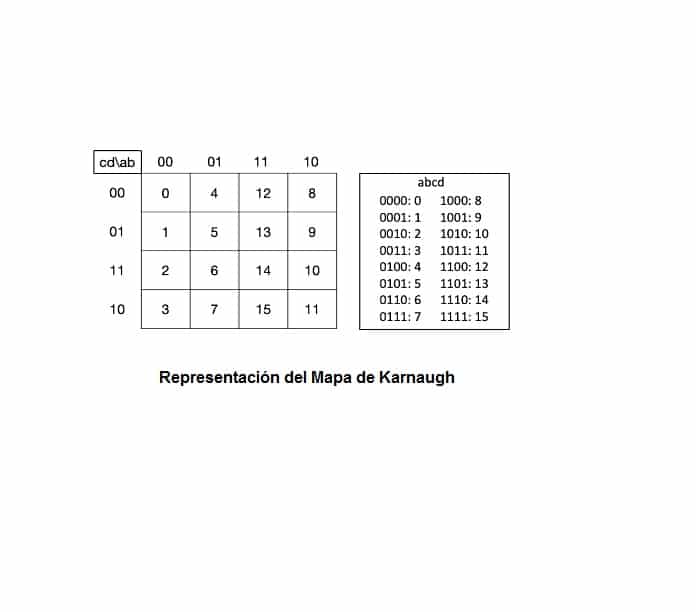
In the previous figure you can see the sample of the binary code when a function of 4 values is presented. The logical variables displayed (A, B, C, D) respectively belong to one bit of the binary code.
When put into practice, you don't need to explain every box; it is enough to interpret the vertical and horizontal header respectively, as shown.
When the binary encoding is already established, each box assigns a “1” if applicable according to the respective canonical terminology of the function, and if not a “0”. When it is made as a truth table, there is the option of using the canonical expression to introduce the function.
The correct thing is to select the one that contains less numerical values. For this, it is only necessary to select the way that includes the least number of values. You just need to know how much numbering there is in the logical interpretation (corresponds to columns that have “1").
If the number of interpretations outweighs the formula and fewer than the number of unhelpful numbers are found, then the canonical DNF way is taken. If the CNF form is not selected.
When the map of K is already made, the simplification of the numbers begins, if possible. Making groups of boxes that are contiguous with variable "1".
Next, the DNF canonical ways decrement algorithm will be briefly explained.
Reduction of a Logical Function with DNF Expression
When you have done the karnaugh maps which expresses the logical functions in DNF, the process is as follows.
The first thing that must be done is the grouping of the gangs that have the variables “1” taking into account the rules:
The groupings must be formed only by the value “1".
The number of cells that have the value "1" that are in a group must be a power of the number "2" What (1, 2, 4, 8, 16, …, n).
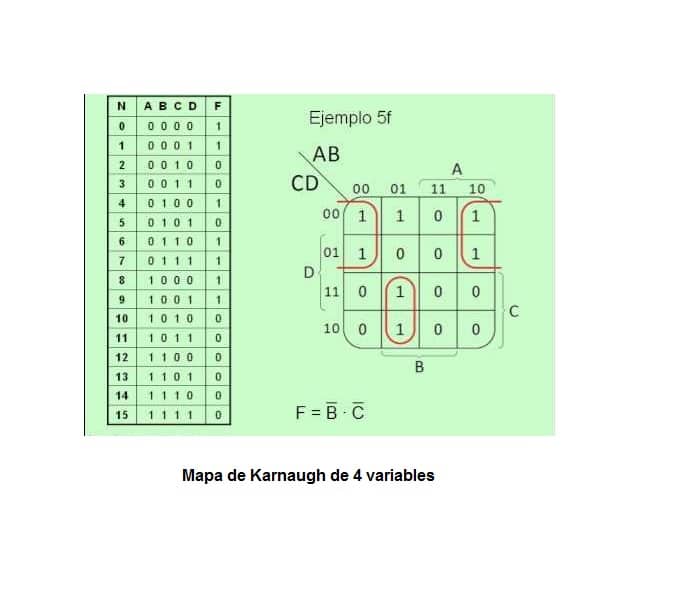
For the creation of the groups, it must be taken into account that the tables are toroidal, since the distant zones or the points are contiguous: the extreme zone on the right side is contiguous with the extreme zone on the left side, in the same way it happens with the upper and the lower side. As you can see in the image below.
The cells that have variable “1” must be in at least one group.
Variables "1” that are in a box can be in different groups.
The number of pools should be small.
While the groups are larger, the decrease will be greater, in the number of terms, as well as the number of literals with a term.
Clusters can vary in size.
If the function finds an interpretation with value “x” that cannot be resolved. The boxes next to it are assigned the value of “x”. And these do not need to join a pool, although they can be used to extend pools that are already made.
Articles that may be of interest to you:
Power Source Characteristics: Summary of Each
Discover Types of Electronic Components
learn all the Search Engine Features